



Paul Johnson, former director of the Institute for Fiscal Studies and Robert Johnson of the Centre for Cities analyse the economic impact of Brexit and its promise of deregulation and growth Since the Brexit referendum of 2016, and since actually leaving the EU in January 2021, the UK’s economic performance
 Paul Johnson



Thursday 09 July 2026 5:53 am | Updated: Wednesday 08 July 2026 12:12 pm
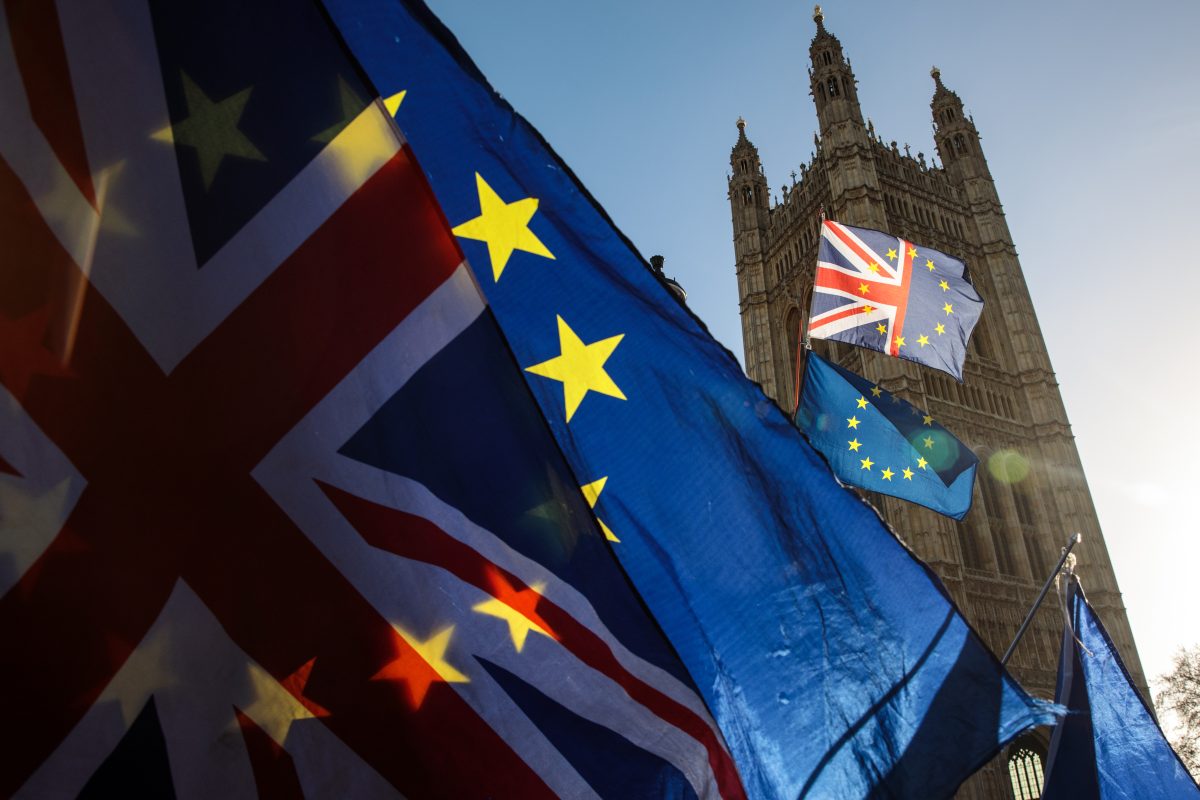 The government is pushing to “reset” relations with the EU
 Paul Johnson, former director of the Institute for Fiscal Studies and Robert Johnson of the Centre for Cities analyse the economic impact of Brexit and its promise of deregulation and growth
Since the Brexit referendum of 2016, and since
actually leaving the EU in January 2021, the UK’s economic performance has been feeble. On a per capita basis, the economy expanded by a mere six per cent in real terms between June 2016 and September 2025. Productivity has flatlined and real wages have risen by just seven per cent. Since the eve of the pandemic – closer to when the UK actually left the EU and the single market – the picture is even gloomier. Real GDP per head at the end of 2025 is almost exactly where it was at the start of 2020 (when the year-long transition period began), having grown by less than one per cent.
Of course, none of that tells us anything about the economic consequences of Brexit. Growth along all these dimensions was also feeble in the years running up to the referendum. Covid, the energy price spike after the Russian invasion of Ukraine and other decisions taken by the UK government have all had their effects. It is also important to distinguish the effects of the vote for Brexit itself from the political chaos that ensued. Suppose the vote had gone 52 per cent to 48 per cent the other way. Would we have had a period of political calm and wise economic policy? It seems doubtful. Political chaos and historically high levels of economic and political uncertainty might well have followed.
That said, we do know that financial and currency markets responded quickly to the referendum result. Sterling depre iated by around 10 per cent on a trade-weighted basis immediately after the vote, raising prices faced by consumers by an estimated 2.9 per cent in the two years thereafter, with a consequent effect on reducing real living standards. For firms, the referendum and its aftermath of political instability increased uncertainty and raised barriers to investment.
#mc_embed_signup { background: #fff; clear: left; font: 14px Helvetica, Arial,sans-serif; width: 100%; max-width: 600px; margin: 20px 0; } #mc-embedded-subscribe-form { margin: 20px 0 !important; } .newsletter-form-flex { display: flex; gap: 0; align-items: center; margin-top: -10px; } .newsletter-form-flex input[type=”email”] { flex: 1; padding: 2px 10px; border: 1px solid rgb(18, 22, 23) !important; border-radius: 12px 0 0 12px !important; } .newsletter-form-flex input[type=”submit”] { padding: 4px 10px !important; margin: 0 !important; background-color: rgb(18, 22, 23) !important; color: rgb(255, 255, 255) !important; border: 1px solid rgb(18, 22, 23) !important; border-radius: 0 12px 12px 0 !important; } .newsletter-banner-content { margin-bottom: 15px; } .newsletter-banner-content h2 { margin: 0 0 10px 0; font-size: 18px; font-weight: 600; } .newsletter-banner-content p { margin: 0 0 10px 0; line-height: 1.5; } .newsletter-banner-content ul, .newsletter-banner-content ol { margin: 0 0 10px 20px; } .newsletter-banner-content a { color: #0073aa; text-decoration: none; } .newsletter-banner-content a:hover { text-decoration: underline; } .newsletter-banner-content img { max-width: 100%; height: auto; margin: 10px 0; } #mc_embed_signup #mce-success-response { color: #0356a5; display: none; margin: 0 0 10px; width: 100%; } #mc_embed_signup div#mce-responses { float: left; top: -1.4em; padding: 0; overflow: hidden; width: 100%; margin: 0; clear: both; }
For the rest of this chapter, we focus mostly on the longer term consequences. We start by outlining, briefly, the key economic claims and forecasts made at the time of the referendum. These matter not just for historical purposes, but also because ‘consensus’ estimates and assumptions made by key policy makers, notably at the Office for Budget Responsibility, have changed little since then. We then present some of the basic data on UK economic performance over the period, and look at how that compares with similar countries. We proceed to consider in more detail what has happened to trade and business investment, the key routes through which any economic impacts are likely to have been transmitted. We briefly review claims that big regulatory changes might have had positive effects. Immigration is dealt with elsewhere in this volume.
The Debate
The economics profession was, in the run-up to the referendum, almost unanimous in its view that Brexit would be damaging for the UK’s economy. In one poll of professional economists, 88 per cent expected national income to be negatively affected over the subsequent five years by leaving the EU and single market. Just four per cent thought GDP would be positively affected.
That might come as a surprise to those who remember that there always seemed to be an economist ready to appear or on either side of the argument. That provided a false impression.
Trade barriers create costs. The EU single market is the world’s best integrated multinational trading arrangement, quite different from standard free trade agreements.
Some 44 per cent of the UK’s exports went to the EU, and another 20 per cent to the United States. Other countries’ shares of trade, especially of exports, were low. It would have required very large proportional increases in trade with non-EU countries to make up for small proportional changes in trade with the EU. A substantive change to trading arrangements with the United States was never on the cards.
The fact that the EU is close to the UK also matters. The dominant model in the economics of trade is known as the ‘gravity model’ – the gravitational pull of big and close trading partners is greater than that of small and distant ones. The EU is both big and close.
Given the scale of that trade and the importance of being part of a large single market, it is unsurprising that, in a survey of forecasts carried out just before the referendum, only one of eight showed a positive impact of leaving the EU, and that was one carried out by ‘Economists for Brexit’. Forecasts from the IMF, OECD, Treasury, National Institute for Economic and Social Research, PwC and Oxford Economics all suggested significant negative effects on the size of the economy, though with a considerable range, depending on methodology and what effects were included. At the top end, some forecasts suggested a hit to the economy as great as eight per cent of national income by 2030, though most suggested an effect of something between two and five per cent.
A second strand of the economic argument related to the fiscal consequences. This, arguably, proved far more important in the debate. In a purely static sense, not being in the EU saves money because the UK was a net contributor to the EU budget, to the tune of some £8bn a year in 2015. That is a much easier number to understand than the range of possible effects on growth resulting from the operation of different economic forecasting models.
Even so, pro-Brexit campaigners chose to use a different, bigger number – the gross contribution, ignoring both the rebate that the UK received and the money spent by the EU in the UK on, for example, agricultural subsidies and support for the UK’s poorer regions. Using the gross number of £18bn a year, they claimed that the UK government would have an additional £350m a week to spend on the NHS. This was tendentious but effective.
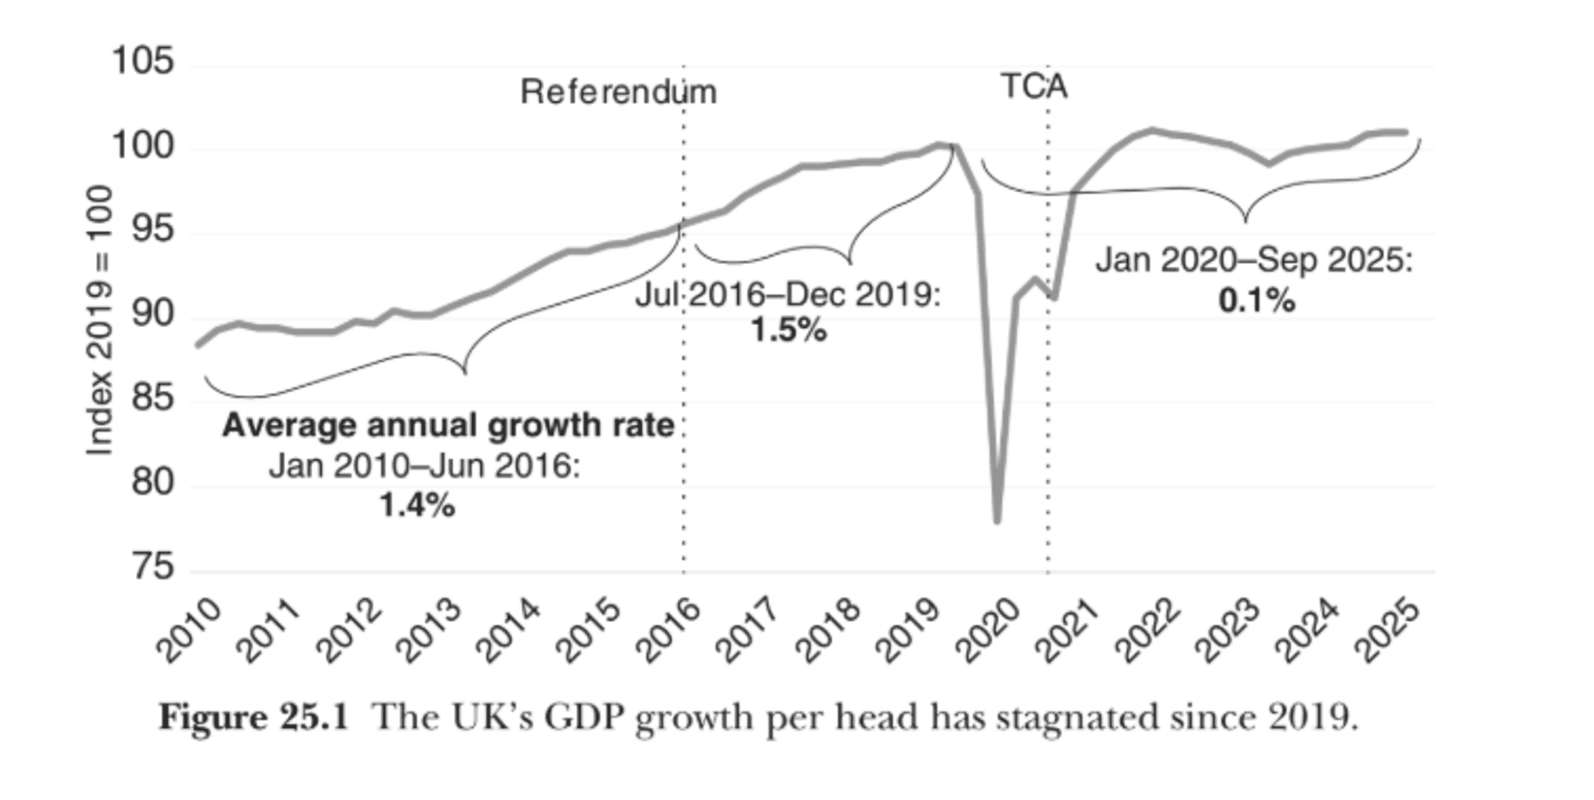
Figure 25.1 shows UK real GDP per capita since after the financial crisis in 2010.
Average per capita growth rates were 1.4 per cent per year leading up to the referendum and remained relatively stable in the period after that, up to the eve of the pandemic, at 1.5 per cent per year. The implementation of the Trade and Cooperation Agreement (TCA) – the formal exit of the UK from the EU – happened in January 2021 during the Covid pandemic. So, rather than looking at growth from that point, it is more useful to look at growth in GDP per capita in the period from the end of the 2019, immediately before the pandemic, through to the end of 2025. Over that period, growth has been almost nonexistent: GDP per capita in September 2025 was just one per cent higher than at the end of 2019.
Much more interesting and potentially informative is to look at how the UK economy has done relative to other ‘similar’ economies which faced the same pandemic shock after 2019 (Figure 25.2).
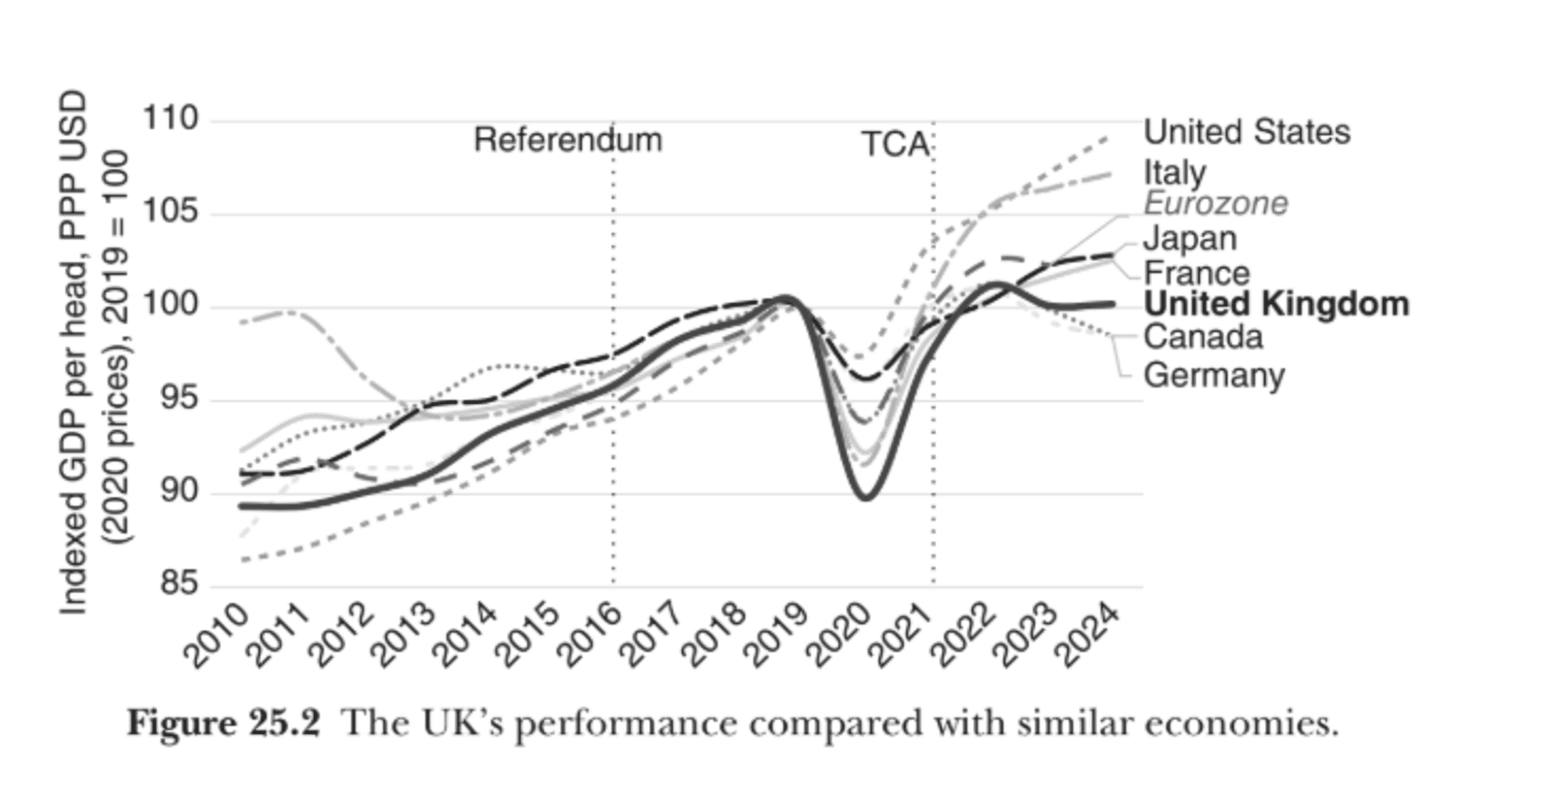
Only Germany and Canada in the G7 have had lower GDP growth per head since 2019, ending up below where they were before the pandemic (though Germany’s output per person remains 10 per cent higher than that of the UK). While the UK has stagnated, the rest of the G7 (and the Eurozone as a whole) has grown faster. US output per person was 10 per cent larger in the five years since 2019 – this means that the US economy produces a third more per person than the UK in 2024, up from a fifth more just before the pandemic. The UK looks like a poor performer, but these comparisons don’t tell us much about the effects of the TCA and exit from the EU.
What we really need is some way to look at what would have happened had the UK not left the EU. That is obviously difficult.
Some researchers have tried to construct counterfactual economies and ask what UK growth would have looked like, absent Brexit, using statistical techniques and the creation of so-called ‘doppelganger’ economies. This literature attempts to say how an economy like the UK’s would have performed without the ‘Brexit shock’ and compares this with the UK’s actual outturn. Using this method and the most recent data, a handful of studies (Table 25.1) estimate that the UK’s economy in the mid 2020s is two–eight per cent smaller than if we had not left the EU. Much of this effect has come after the UK’s trading arrangement changed in January 2021 – earlier studies considering solely the period up to this point found a one–three per cent impact.
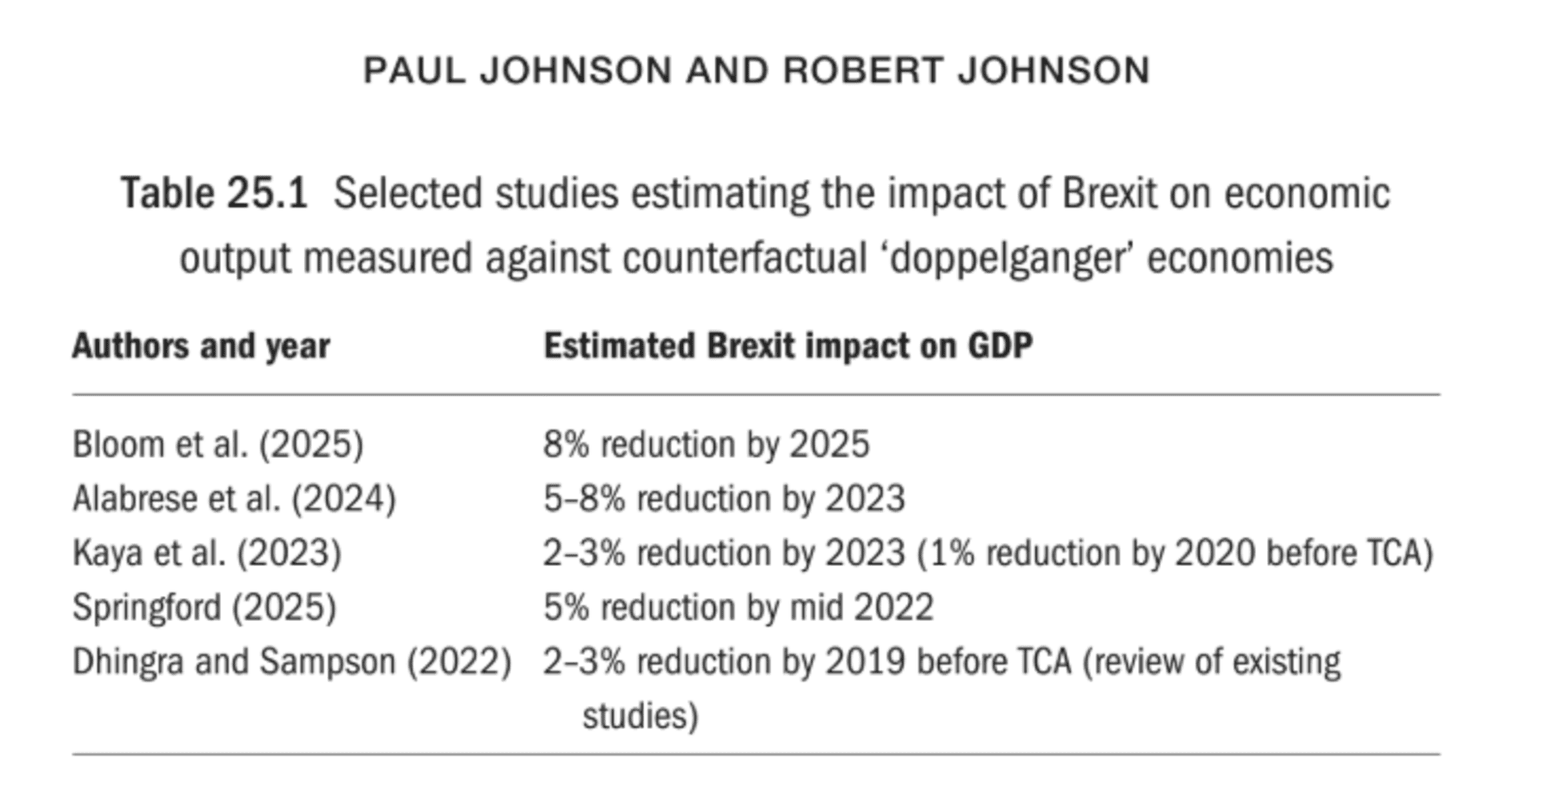
The problem with these estimates is that they cannot, by building a counterfactual from other countries, account for the specific political developments the UK experienced that probably would have happened without Brexit. This includes potential ongoing political instability in the case of a close vote the other way, but also the UK’s specific policy response to the pandemic (such as the furlough scheme).
The 2025 study by Nick Bloom et al. uses both a macro approach, comparing the performance of the UK economy with that of similar economies, and a microeconomic approach using firm-level data. It is worth saying that this paper was published by the prestigious American National Bureau of Economic Research, and authored by some of the world’s most respected academic economists. They conclude as follows:
“We estimate that by the start of 2025, the UK economy was approximately eight per cent smaller than it would have been without Brexit, based on macro data, and six per cent smaller using firm-level micro data. Investment is estimated to have been 12–18 per cent lower, employment three–four per cent lower and productivity also three–four per cent lower than it would have been if the UK had not voted to leave the EU.
We show that Brexit generated a large, broad and long lasting increase in uncertainty. This contributed to lower business investment, in particular, but it also may have reduced productivity too by restraining innovation and spending on potentially productivity enhancing forms of capital expenditure. We also show how the time and resources firms devoted to preparing for Brexit were strongly correlated with lower productivity. These channels have potentially been more important than the effects of reduced trade with the EU, at least initially, although the ways in which Brexit affects productivity will change over time and the trade effects may well become more important.”
None of these studies is perfect. But the weight of evidence is overwhelming. Studies comparing the UK with similar economies at a macroeconomic level and those building from firm level data all agree on a significant negative effect. Its size is somewhat uncertain, but of the same order of magnitude as the scale of impact estimated by the ex ante studies carried out in the run-up to the referendum.
To get a better understanding of the economic consequences, we need to dig into the components of change, of which the biggest has been in our trading relationship with the EU.
Trade
Until January 2021, the UK’s trading relationship with the EU remained broadly unchanged. It continued to be in the single market and customs union. Since then, trade has been governed by the TCA. The TCA is a free trade agreement with zero tariffs and no quotas. This goes further than any other EU trade deal with a third country.
But it leaves the UK outside both the single market and the customs union. Despite zero tariffs, this creates substantial barriers to trade through customs checks and a regulatory border. So called ‘rules of origin’ requirements make some forms of trade difficult or impossible. For example, cane sugar imported from the Caribbean and refined in the UK does not qualify for access to the EU tariff-free, nor does basmati rice imported from India and milled in the UK. Cars must contain no more than 45 per cent of materials coming from neither the UK nor the EU. After the transition period ends in 2026, electric cars will not qualify for tariff-free trade if their batteries were imported from outside the UK or EU.
While UK trade with the EU did not appear to change relative to UK trade with the rest of the world between the referendum and the TCA coming into force, it did then drop immediately and significantly. That fall was driven almost entirely by smaller firms, some of which appeared to respond by stopping trade completely. The biggest firms, in contrast, seem not to have responded. This pattern probably reflects the fact that the fixed costs of trade rose. Large firms can cover such additional costs – employing a small number of additional people to manage the paperwork, for example. Many smaller firms find it uneconomic to continue trading at all. Analysis from the LSE10 suggests that the TCA caused around 16,400 firms to stop exporting to the EU entirely, that being some 14 per cent of all EU exporting firms. This meant a 30 per cent fall in exports from these firms overall. In its first review of UK trade policy since the TCA, the World Trade Organization noted that a stagnation of trade’s contribution to GDP has been driven by goods exports, which in 2024 were 17 per cent below 2018 levels in real terms.
The Office for Budget Responsibility (OBR) continues to assume that there will be a long-term reduction both in UK exports and in UK imports of around 15 per cent as a result of the TCA, an estimate first made in the wake of the referendum on the assumption that a ‘standard’ free trade agreement would be reached. In 2022, the OBR reported that ‘the UK therefore appears to have become a less trade intensive economy, with trade as a share of GDP falling 12 per cent since 2019, two and a half times more than in any other G7 country’. In 2025, the OBR continued to assume that ‘both exports and imports will be around 15 per cent lower in the long run than if the UK had remained in the EU’. Reduced openness to trade has a direct knock-on effect on economic growth. To the extent that the new arrangements create barriers to trade for smaller firms, the longer-term effects of reduced dynamism may be larger than seen up to now.
Read more On this day: Brits vote in referendum that changes everything
The effect on trade in services was harder to predict ex ante than the effect on trade in goods. In the latter case, it is possible to measure barriers at the border, and indeed assign a tariff equivalent to the effects of those barriers.
The sorts of barriers faced by exporters of services are less visible: mutual recognition of standards and qualifications, for example. The UK is, of course, a services-heavy economy: services account for around three-quarters of its national income and 60 per cent of exports, and, while the UK runs a substantial trade deficit overall, it has a surplus in trade in services.
At first sight, trade in services appears to have been unaffected – even improved – especially when compared with the observed drop off in goods trade for the UK relative to other G7 economies (Figure 25.3).
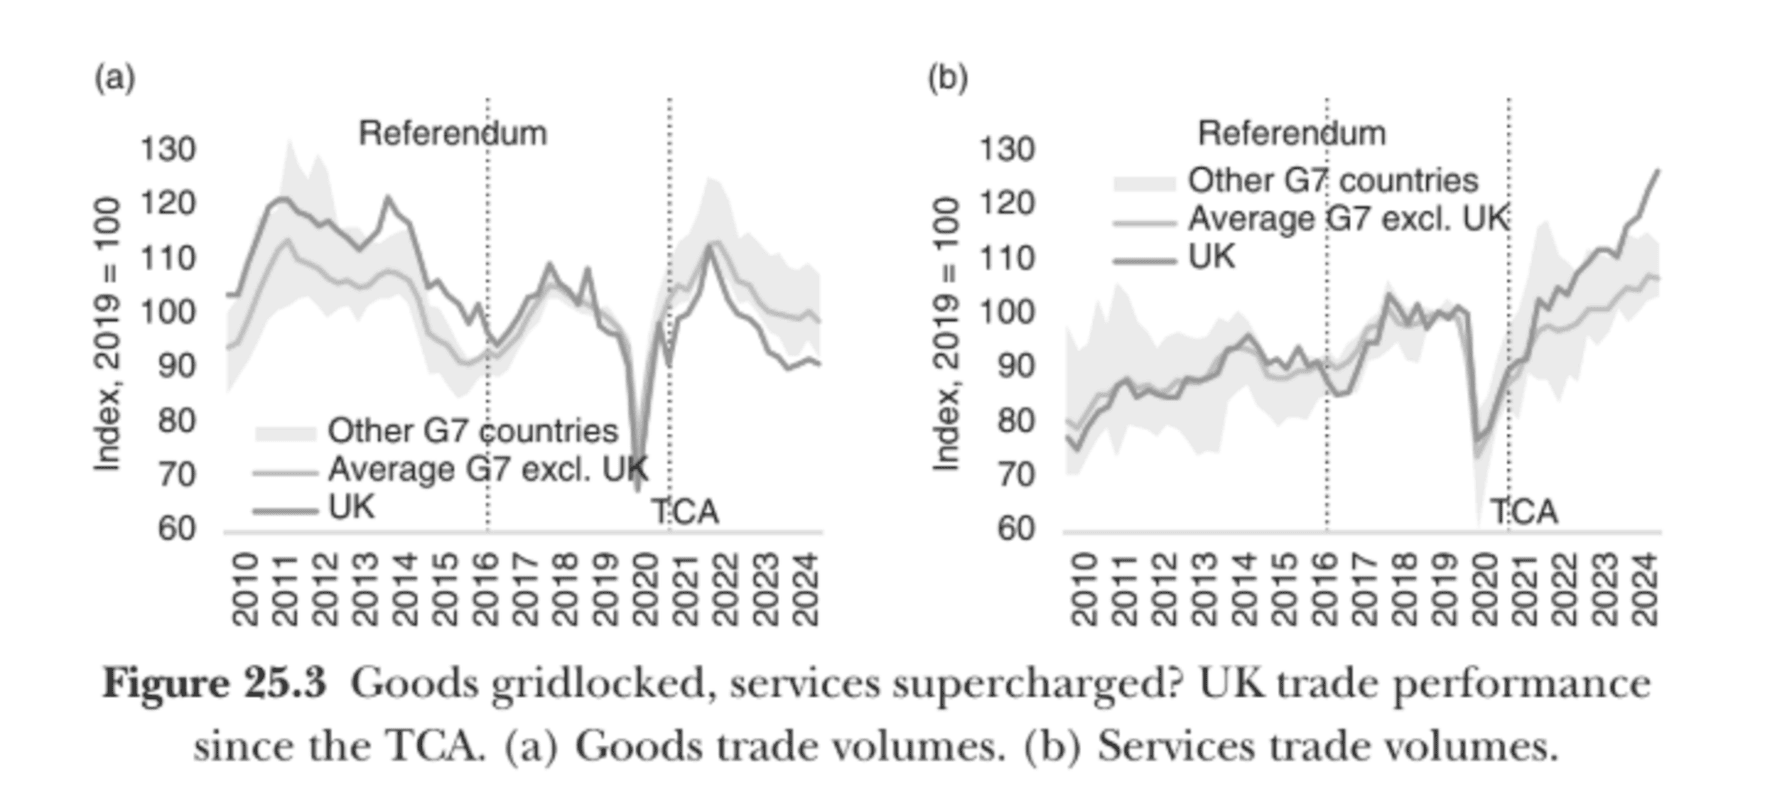
Indeed, it has been argued that the weakness of goods exports in the period since the TCA has been overstated, as many of the UK’s high-value goods exports (such as jet engines) are reported as services, helping to drive the uptick in services exports.
The reality is that performance has been distinctly variable. Those areas where Brexit has had little or no impact, for example management consultancy, research and advertising, have indeed seen strong export growth.
Others, including finance and transport, which were much more affected by leaving the single market, have performed less well. That is indicative in itself, but doesn’t provide causal evidence of impact.
More robust analysis, however, has looked at the growth in services trade across different sectors and between different countries, and compared growth in UK services exports by sector with those in other countries. By then looking at the extent to which each sector has been affected by new barriers following the introduction of the TCA, it is possible to see where the UK has performed more or less well than it ‘should’ have done. This work concludes that, on average, there was a 16 per cent drop in services exports to the EU in sectors where Brexit imposed new trade frictions compared with bilateral trade between other countries in the same sectors. That was not made up for by greater trade with other countries. Overall, UK services exports five